October 6, 2023 – There’s been a lot of chatter about the Bill Perkins book “Die With Zero” and its approach to life and retirement planning. Most recently, just yesterday on the awesome Accidentally Retired blog. After several readers asked me about my views on the “Die With Zero” idea, I finally relented and decided to write a piece in my Safe Withdrawal Rate Series on the topic.
I’ll briefly describe the areas where I agree with Perkins. But then I also go through all of the fallacies in this approach. Let’s take a look…
What I like about the Die With Zero book
First, I see some parallels between Perkins and me. Like Perkins, I used to work in finance and called it quits at a very productive point in my career to focus on more important things in life. Of course, Bill Perkins’ net worth is much higher, but in qualitative terms, I can still relate to his life story. Why work into my 60s to build an even larger nest egg when I had enough at age 44 to live comfortably? Sure, I might have 10x-ed my net worth over the 20 years of peak earnings between my mid-40s and mid-60s. I would have been even more comfortable, but I would have paid the opportunity cost of missing out on lavish travel and the peace and tranquility of the relaxed suburban life here in Camas, WA. So, in 2018, had the book been out then, I would not have learned anything pathbreaking and new. But I would have certainly enjoyed Perkins’ work as an additional motivational impetus to quit my job.
Second, I like Perkins’ idea of focusing on experiences over consumption of material goods. Even though, with his nine-digit net worth, I’m certain Perkins has some nice material stuff, too. But of course, the idea is that almost all material stuff depreciates and fades, while memories of past experiences will flourish.
Third, I like the idea of not going too hard-core on the frugality idea when planning for FIRE. It reminds me of my popular 2021 post, Stealth Frugality, where I propose to live a generally frugal life but don’t become so frugal that people start talking behind your back about what a weirdo you have become. As the name of the post suggests, we were frugal without people even noticing, sprinkling in some conspicuous consumption clues to the outside world. I did not need to “borrow” a Netflix password from friends and relatives or other crazy, unhinged antics that some folks in the FIRE community pursue. Sure, it took me a little longer to reach FIRE, but at least I could enjoy the ride. Perkins would surely agree.
Fourth, I like the idea of bringing more people into the FIRE community. The current FIRE influencers spend a lot of energy marketing to people with low net worth levels, say, the folks who just graduated from Dave Ramsey, got out of debt, and are now ready and willing to keep going. That’s all a noble cause, but few folks will have the stamina to go through the likely 10-year or longer accumulation phase to reach FIRE. We should expand the search for FIRE enthusiasts to the already affluent who, for some reason, don’t even realize they are FIRE or close to FIRE. I’m not sure there are many such “oblivious FI folks,” but we should try to grow the movement any way we can.
But there are also several areas where I’m afraid I have to disagree with Perkins’ work…
1: Die With Zero and Capital Depletion are nothing new!
Quite intriguingly, the idea of depleting your portfolio is not new. The success criterion of the 4% Rule is capital depletion. Depletion, as in “having $0.01 at the end of retirement, counts as a success.” I frequently hear people talking about how innovative the Die With Zero approach is and how it allows you to withdraw more money and retire early. For example:
[The Die With Zero method’s recommended nest egg] will be lower than the traditional advice of multiplying your salary or spending by 25 – a popular calculation used and recommended by financial planners that’s based on an annual 4% withdrawal rate. But, for those who want to spend down all their money in their lifetime, that calculation may yield too high of an estimate.
Source: Business Insider, May 15, 2021
I have to wonder: did I miss something? Did I misread the Trinity Study? No. It’s just another day of mathematically illiterate people confusing and confounding simple mathematical and financial concepts. Case in point: the writer(s) at Business Insider falsely assumed that the Trinity Study was based on Captial Preservation. It’s not. Historically, using a 75/25 portfolio and a 30-year horizon, the 4% rule would have run out of money just about 2% of the time. So, using capital depletion (=dying with zero) as the success criterion, you would have succeeded 98% of the time.
Also, the 4% Rule would have preserved the (real) initial portfolio value only 70% of the time. In fact, conditioning on a CAPE Ratio greater than 20 (today’s value is closer to 30), the probability of maintaining your (real) portfolio value after 30 years drops to less than 50%. So, again, the Trinity Study, Bill Bengen’s work, and much of the Safe Withdrawal analysis out there are not usually based on capital preservation. But please see Part 2 of the series for an in-depth analysis of the capital depletion vs. preservation issue. I demonstrated that if you want capital preservation, you’d typically need a nest egg much larger than 25x expenses.
Thus, if people claim that Die With Zero automatically allows you to withdraw more and/or retire with a smaller nest egg (and therefore earlier) because of capital depletion, that’s false advertising. In Perkins’ defense, he is not explicitly making that Straw Man Argument about the Trinity Study. It’s mostly the journalists and some FIRE influencers. But Perkins is also not doing much to put this misunderstanding to rest either, so he’s at least partially responsible.
But, I indeed concede that the 4% Rule likely leads to a sizable nest egg at the end of your retirement in 98-99% of the historical cohorts that didn’t run out of money. So, I am the first to admit that if you calibrate your withdrawal strategy to the historical worst-case scenarios, then you set yourself up for potentially overaccumulating because asset returns are volatile, and it’s difficult to pick a withdrawal amount that generates a “point landing” of $0 assets and the end of your life.
2: Vast overaccumulation in retirement isn’t that much of a problem.
In an interview, Perkins laments that most retirees don’t get close to depleting their savings. He references a 2016 study that shows that the median 75+-year-old American has more money than the median 65 to 74-year-old ($281,600 vs. $237,600). In the book, he uses 224,100 and 264,800, respectively, which are the 2016 numbers in 2016 dollars, while the numbers in the Business Insider article are the 2016 numbers in 2019 dollars. The ratios are the same, though.
There are multiple problems with his interpretation of these statistics. First, neither $281k nor $237k is very impressive. I don’t consider that overaccumulation. Healthy 75-year-olds still have 10+ years of life expectancy, and much more when factoring in joint life expectancies of couples. So, it’s not like $281k is all useless extra cash. If I assume $100k of that $281k is excess savings, how much is that really in the grand scheme? If you assume a (conservative) 5% return on equities (over the long run, it was closer to 6.7%), this retiree could have spent an additional annual amount of $454.93 between the ages of 25 and 74 to lower the retirement nest egg by those $100,000. Excel formula: =PMT(0.05,50,0,-100000,1)
It is better than nothing, but it wouldn’t have made a big difference in your young-age spending. You can’t miraculously send those $100,000 through a time machine to your younger self to fly in a private plane and party in the Bahamas (one of the author’s memorable anecdotes). The issue here again is the time value of money. Someone with finance training should know that!
Second, these numbers don’t necessarily prove that individual retirees grew their net worth. A single-year snapshot for 2016 does not tell us anything about the net worth of the current 75+ cohort when they were younger. For that, we’d need panel data, or the very least, the SCF data from years prior. If anyone has trouble understanding the basic distinction between panel data vs. time series vs. cross-sectional data, please continue your motivational speaker shtick, but stay out of debates about data analysis! You’re embarrassing yourself.
Besides, if you bother to look up the source data at the Federal Reserve, you will find the following table:
Clik here to view.

Well, isn’t that interesting? The 2019 Survey of Consumer Finances report includes data for both 2016 and 2019. Those 2019 figures were available at the book’s publication date. But Perkins mentions only the (outdated!) 2016 number but ignores the more recent 2019 figures because they would have negated his central premise. In 2019, the older cohort had a slightly smaller median net worth: $254.8k vs. $266.4k (=-4%) and a significantly lower average net worth: $977.6k vs. $1.217.7m (=-21%). Also, notice that between 2016 and 2019, both the median and mean net worth of the 75+ cohort declined by 10% and 14%, respectively. Again, due to composition changes in the three years (new folks entering the 75+ cohort and people dying), it’s not entirely appropriate to make too big a deal of the percent changes. But this drop points to a significant withdrawal from retirement portfolios of the 75+ cohort, considering that the stock market rallied by over 50% nominal and over 40% in real terms between 2016 and 2019.
Also, looking at a more extended sample of household net worth numbers from all the past Surveys of Consumer Finances conducted every three years between 1989 and 2019, most of the time, the 75+ cohort had a smaller net worth than the younger 65-74 cohort. The lower net worth is even more pronounced in the mean figures than the median numbers. So, focusing on that one little outlier blip from 2016 and ignoring all the age cohort data, it feels like someone is fudging the numbers. Sorry, Bill, you just lost a lot of reputation! You have crossed the line of data analysis malpractice.
Clik here to view.

Update 10/18/2023: The new 2022 SCF data are out. Again, the mean and median net worth numbers for 75+ are below the 65-74 age group. Please see the chart below:
Clik here to view.

But you know what? The last few paragraphs are still mostly moot. They mainly showcase his and his ghostwriters’ confirmation bias data hackery. Even if I were to concede all points to Perkins, namely, that the average retiree in the late 2010s and early 2020s has not spent much of his/her nest egg, that doesn’t mean anything. Our current retiree population is likely one of the luckiest ever. Most of them accumulated assets during the best bull market ever, 1982-2001, with only short and shallow bear markets in between (1987, 1991). The Dot Com crash (2001-2003) and the Global Financial crisis (2007-2009) did produce deep equity bear markets, but they were short and easily diversifiable with a large enough bond share. And the strong bull market since March 2009 – again with temporary and shallow interruptions – is also one of the best market rallies ever. Today’s retirees, aged 65+ and especially 75+, experienced the best Sequence of Return Risk imaginable. Good for them, but there is no guarantee that future retiree generations will fare so well again. Side note: there may be a very narrow slice of the current retiree population that retired at or around the bull market peak in 2000, but their numbers are too small to have a significant impact on today’s mean/median stats.
In contrast, retirees from the notorious 1929 and 1965-1968 cohorts would be about 120 to 160 years old today. They are no longer around! But their memory is. That information about past drawdowns and past stock/bond correlations made it into the statistical distributions that rational and reasonable financial planners ought to use when drafting retirement plans, whether it’s professional financial planners or DIY amateurs like us in the FIRE community. And because nobody could have known ex-ante how superbly well financial markets would work out eventually, it’s no surprise that we have some excess precautionary savings ex-post. But in a less attractive market environment, the net worth of retirees would have looked very different. As a former energy trader, Perkins should be familiar with risk management and the potential for an asymmetric risk profile. Having money left over at age 95 is less of a headache than running out of money at age 75.
So, if you want my opinion on why there’s some excess net worth in the stats, I can provide two reasons: First, the precautionary savings motive described above, i.e., people hedging against a potentially unfavorable market environment. Ex-ante, that was the rational thing to do, even though ex-post, people will have some excess savings. The median traveler at the airport gate arrived too early for the departure. But it was still the rational thing to do because wasting 30 minutes at the airport is cheaper than arriving 1 minute late, missing the flight, and having to buy a new ticket.
The second reason is the lack of helpful guidance from the financial planning community. Everybody reverts to some naive heuristic, like the 4% Rule. To get a more customized solution, you’re likely stuck with yours truly and maybe a handful of other small niche providers. For example, if you had retired in 2003 or 2009 and used a 4% Rule, it’s no wonder that your portfolio grew during your retirement. At and around those bear market bottoms, you should have used at least a 5-6% withdrawal rate to account for the attractive equity valuations. So, I agree with Perkins that the mainstream retirement community is confused about the quantitative side of retirement planning. But Bill Perkins’ is even more confused and proposes an even dumber rule than the 4% Rule. This brings me to the next issue…
3: The Die With Zero savings target is not linear in the horizon
This is probably the most disappointing feature of Perkins’ work. You would think that as a former finance professional and energy trader, he’d spend much more time on his magic formula, i.e., the savings target you should aspire to retire. But the best he can come up with is this:
Nest Egg Target = Retirement horizon * annual budget * 0.7That’s it? Why is the formula linear in the retirement horizon? That goes against the most fundamental financial insight: the time value of money. If you have twice the horizon, you shouldn’t need twice the nest egg because the second half of your retirement needs less than the first half. (There is, of course, one exception, namely, when the expected real return is zero, in which case the nest egg target becomes linear, i.e., retirement horizon times annual budget. But then you would underestimate the target by 30% because you would not get that 0.7 multiplier.)
I can easily demonstrate how wrong Bill’s math is. First, assume you can access an investment with a fixed real rate of return. One could use a TIPS ladder, for example. In the chart below, I plot the nest egg target as a function of the horizon. All lines are plotted as multiples of the annual budget. I do so for the DWZ formula (T*0.7) and portfolios with different real rates of return ranging from 0% to 6% p.a. I also plot the 4% Rule of Thumb as a single dot, i.e., 25x at a 30-year horizon. The lines are clearly not linear, except for the aforementioned 0% rate, where you’d be way above the DWZ rule. Using real returns between 2% and 3% (30y TIPS rate as of 10/5/2023 is 2.50%), you’d need a much smaller nest egg for a very long retirement horizon beyond 30 to 40 years. And you’d need a significantly larger nest egg than 0.7*T for short horizons. In fact, not even with equity-like real returns would you get away with a nest egg of only 7x when your horizon is ten years. So, the Bill Perkins formula is thoroughly incorrect and useless if you want to implement it through a TIPS ladder. The curves are not straight, and their slope is not 0.7. (side note: I’m aware that TIPS only go out to 30 years, so you may still face some residual interest rate risk when facing a horizon of more than 30 years).
Clik here to view.

Another approach would be a Single Premium Immediate Annuity (SPIA). I went to the website Immediate Annuities (I’m not affiliated with them, but I like how easy it is to get quotes there) and pulled some SPIA annuity quotes for males, females, and couples at different current ages between 40 and 90 years old (in 5-year steps). I assume the couple consists of a male and a female, both of the same age. For the DWZ formula, I assume a life expectancy of 95; for example, a 40-year-old would use a 55-year horizon. Or a 65-year-old would target the standard 30-year retirement horizon. Here are the net worth targets as multiple of the annual budget and as a function of the current age. Notice that the curves decrease because we have the retiree’s age, not the horizon, on the x-axis.
Clik here to view.
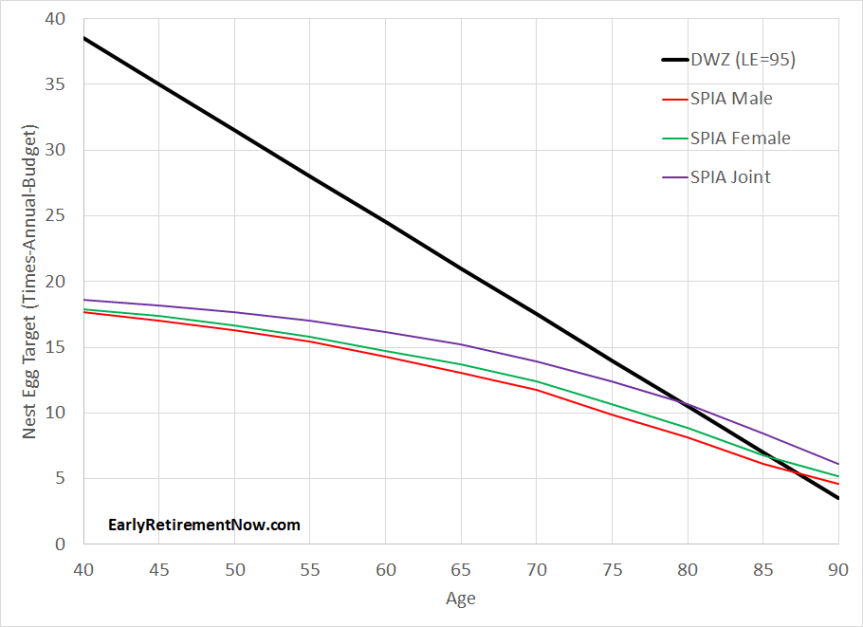
Notice how the curves are not linear and have a slope nowhere near 0.7. In fact, for younger retirees, you again need a much smaller nest egg than the 0.7*horizon formula would suggest. But also notice that SPIAs are not inflation-adjusted. Especially over longer horizons, you expect to wipe out a significant part of your purchasing power. For example, 40-year-old retirees with a (potential) 55-year horizon would deplete about two-thirds of their purchasing power, assuming a 2% trend inflation rate. At 2.5% inflation, you will erase 75% of your purchasing power and more than 81% when the CPI is 3%. That might cut it too tight for early retirees with a frugal budget. Say, if you think you can survive on $25k today, will you be able to live with dignity on $6-$8k a year (inflation-adjusted) when you’re in your 90s? I don’t think so!
So, if you’re a 40-year-old retiree, you may be impressed with the whopping 5.66% SWR for single males, 5.58% for single females, and 5.38% for couples. But don’t be tempted to put your entire nest egg into one single nominal SPIA and retire with only 17-19x your current budget. Leave a sizable(!) reserve to deal with the inevitable depletion of your purchasing power! How do you do that? I model this COLA adjustment as a withdrawal case study that slowly phases in withdrawals to make up for an assumed 2% inflation rate. I’m using a 75/25 portfolio and calculating the historical fail-safe cohort to see how much you need to set aside to exactly deplete your money in that worst-case scenario. See the chart below. Now, we’ve shifted the minimum nest egg requirement to just above 25x. It is still better than the 0.7*55=38.5 from the DWZ formula. Don’t get too confident, though, because inflation could come in much worse than 2%, which explains why SPIA+2% gives you a seemingly higher SWR/lower nest egg target than a traditional SWR analysis.
Clik here to view.

But also notice that, as before, the SPIA-recommended nest egg sizes are much larger than the DWZ formula when you get to your 80s. Here, the nonlinearity of the withdrawal and annuity math works against you, and you need significantly more than the DWZ linear formula would recommend.
Finally, we can plot the failsafe retirement nest egg that would have survived a retirement using a 75/25 portfolio with a capital depletion target. That’s the standard ERN approach, straight out of my Google Simulation Sheet (see Part 28 for details). Again, nest egg targets are not linear, and the slope isn’t 0.7.
You’d need more than 25x to hedge a 30-year retirement as recommended by the 4% Rule (i.e., you need the extra cash to hedge out that residual 1-2% risk of running out of money). I also plot the nest egg target when you model a slowly declining real retirement budget, melting away 1% of the budget every year, and you can shift down the curve. A lot of folks, Perkins included, tout this consumption shrinkage as the panacea to retirement savings. There is indeed a significant drop in the nest egg target, but the curve is still not at all linear and doesn’t have a slope of 0.7 either.
Clik here to view.

Summary so far: your target nest egg should not be linear in your retirement horizon. None of the commonly used retirement tactics (TIPS ladder, SPIA, SWR analysis a la Trinity or ERN) will ever generate a linear function in your horizon. If you’re young, you’ll need less; if you’re old, you’ll need more than what Perkins recommends.
4: The savings target should depend on future expected cash flows
Another issue that Perkins seems to ignore is that retirees may have future cash flows. Young retirees should certainly account for future Social Security and pension income, albeit applying a small cut to hedge against potential policy risk. I will not elaborate on this issue because it should still be fresh in everybody’s memory after reading last month’s post in the SWR Series: Social Security Timing – SWR Series Part 59. But even traditional retirees often like to account for, say, a potential future downgrade in their primary residence or other supplemental flows. Without guidance on how to factor in such future flows, the already problematic linear nest egg recommendation becomes even more suspect.
5: The savings target should depend on asset valuations
Almost as disappointing as the asinine linear nest egg formula is the absence of any recognition of how asset valuations determine your nest egg target. Case in point: when Perkins wrote this book, ostensibly in 2020 and/or early 2021, we had rock-bottom interest rates. 30-year TIPS rates were below 0%, which would have implied that for a 30-year retirement, you’d need more than 30x annual expenses to hedge your retirement budget even with depletion over 30 years! Not 0.7*30=21x, but 30+x!
In contrast, today’s TIPS rates are again at multi-decade highs. As I showcased in one of the charts above, with CPI-adjusted safe returns that high, you potentially retire with a much smaller nest egg than the recommendation from the DWZ book. Again, the great irony is that the occasion where a linear nest egg target could have been rational would have been the case of zero real rates, where the nest egg target would have been T*Budget. Not 0.7*T*Budget!
Clik here to view.

If you run a traditional safe withdrawal rate analysis, as I do here on the blog, equity valuations are the big gorilla in the room. As I have written on my blog for seven years, your withdrawal strategy should be more cautious when the stock market is at an all-time high vs. in a deep drawdown. In the chart below, I plot the minimum nest egg per $1 of retirement budget to sustain your retirement even if we suffer a repeat of a historical wort-case event. Notice how the failsafe nest egg recommendations differ crucially depending on the equity drawdown, between 0% (=equity all-time-high) and 50% drawdown. If the market is underwater by that much at the start of your retirement, you can sustain your retirement budget with a much smaller nest egg. I was surprised that Perkins, who worked in finance, didn’t think equity valuations should be more prominent in your retirement planning.
Clik here to view.

6: Hedging against old-age health expenditure shocks is feasible
The author has a response to folks wondering about the risk of health and long-term care expenses later in life. I am paraphrasing here: “Don’t even bother; it’s so expensive that you poor little peasants and peons can’t afford it anyway.” He mentions how astronomically expensive it was to pay for his father’s end-of-life care and how even a few days of care would have wiped out most middle-class retirees’ nest eggs. What a sad and defeatist attitude. And how condescending!
His reasoning reminds me of the Suze Orman spat 5 years ago when she argued that nursing homes cost $300k a year. Of course, Suze argued you need a bazillion dollars to retire to pay for a nursing home, while Perkins uses the same argument to push you in the other direction, i.e., retire anyway and just forget about a nursing home altogether. Of course, the reality for most ordinary folks who are not in the 9-figure net worth club is different. There are cheaper options for nursing homes. And most old-age folks should be able to get away with a much lower degree of care, e.g., hire some domestic help with cleaning, gardening, etc. There will be an additional cost, and because nobody knows how much exactly you will need to spend, it is indeed rational to keep some extra precautionary savings around as a reserve. You can’t afford Suze’s Beverly Hills nursing home, but those extra savings will certainly give you peace of mind to be able to pay for unexpected costs later in retirement and live a graceful life.
Moreover, as I have written in a prior post (“When to Worry, When to Wing It? – Part 47), because the nursing home stay or other old-age expenses are so far in the future, it’s usually not something on my mind right now. Even a relatively small bucket invested in 100% equity index funds (due to the long horizon) should give you restful sleep at night.
Summary So Far
The Die With Zero approach reminds me of a quote I once heard from a professor of mine describing the work of another economist I prefer to leave unnamed (luckily, it wasn’t me!):
“Your work is both innovative and intelligent. Unfortunately, the innovative parts aren’t intelligent, and the intelligent parts aren’t innovative.”
In other words, Perkins’ take on early retirement is certainly neat. His style is fresh, and he exudes the high energy and confidence – some would call it cockiness – of someone with a high net worth. I wouldn’t be surprised if he used one of Tony Robbins’ ghostwriters. Therefore, credit where credit is due, the Die With Zero book and his whole philosophy are undoubtedly helpful in bringing more people into the FIRE community, for example, those who are turned off by FIRE’s (undeserved!) reputation of extreme and excessive frugality. Lots of people will be drawn into his narrative and inspired by someone so fabulously rich and confident. But his ideas aren’t new and certainly not revolutionary. His philosophy is a rehash of the “Your Money or Your Life” book from decades ago (which he credits and references), just upping the coolness factor a bit.
However, when Perkins wanders off the beaten path and showcases some “innovative” ideas, he quickly becomes unintelligible and unintelligent. He has a valid point criticizing the status quo of today’s retirement planning landscape that leaves many retirees so uncomfortable touching the principal of their nest eggs. But what he proposes as an alternative, the asinine linear formula (0.7 times horizon times budget), is even less helpful than the generic mainstream B.S. retirement planning tools – if you thought that was even possible.
Perkins’ formula, which ignores some of the most basic finance principles, i.e., time value of money and (high school level!) amortization math, would vastly exaggerate the target nest egg for all FIRE retirees. With a 60-year horizon, he would propose a 42x annual expenses nest egg. But a simple 75/25 portfolio would have sustained a 3.25% withdrawal rate, equivalent to only 31x. And that’s for a bare-bones 60-year retirement without any future supplemental flows like Social Security. With some supplemental flows, you might be able to push your SWR back below 30 and potentially even close to 25x gain. Specifically, Perkins’ formula would all but guarantee that you overaccumulate assets during a FIRE-style retirement, the exact issue that Perkins laments so much. What irony!
Likewise, for very short horizons, say, under 15 years, the DWZ savings target is even more dangerous financial malpractice. It’s far too low and will all but guarantee that money doesn’t last as long as your horizon, even with very aggressive estimates of (CPI-adjusted) expected returns. Thus, no credible retirement planner would ever take the explicit numerical recommendations in that book very seriously.
Luckily, people in their 70s and 80s would likely not even make it to the infamous formula. After that barrage of condescension and insults against old folks of the type “spend your money while young because you’ll be a useless and brainless vegetable when you’re older,” – most 70+-year-olds would have put down the book before page 160. Thus, Grandma and Grandpa will likely be safe from bad financial advice for now! Whew!
A better way to model Die With Zero: The “Safety First” Method
We could consider at least partially moving away from the stereotypical Trinity Study approach of hedging your longevity risk on your own with a large stock/bond portfolio. Safety First often involves moving at least a portion of the portfolio into other asset classes (TIPS ladders, QLACs, standard annuities, etc.), thus sacrificing some or even all of the portfolio growth upside for a higher withdrawal rate.
There are many flavors of the Safety First approach, and Wade Pfau wrote a good summary on Forbes. Since I am already past 5,000 words, I must defer detailed simulations to a future post. But it’s on my to-do list, so stay tuned and watch this space. I will present in a future post how annuities and TIPS ladders can likely improve safe withdrawal rates. Specifically, you give up a large portion of the upside, which some are happy to do because they want to Die With Zero. Still, you hedge against worst-case scenarios, like the bad Sequence Risk events, a la 1929 or 1968, which increases your failsafe withdrawal rate.
As nice as this all sounds, there is one caveat. The attractiveness of the Safety First approach depends crucially on the interest rate landscape. Thanks to the recent rise in rates – both nominal and real (TIPS) rates – some of the previously unattractive strategies suddenly look quite appealing. It may not last, so I hope I get that detailed post ready before interest rates drop again!
Thanks for stopping by today! Please leave your comments and suggestions below! Also, check out the other parts of the series; see here for a guide to all parts so far!
All the usual disclaimers apply!
Picture Credit: pixabay.com
The post How useful is the “Die With Zero” retirement approach? – SWR Series Part 60 appeared first on Early Retirement Now.